library(clusterProfiler)
library(org.Hs.eg.db)
library(enrichplot)
library(pathview)ORA (MOV10)
Vamos a realizar un análisis de sobrerepresentación con los genes diferencialmente expresados del dataset MOV10 (enlace).
Para realizar el análisis utilizaremos el paquete de Bioconductor clusterProfiler, tambien usaremos el paquete org.Hs.eg.db.
Cargar datos
Cargamos los datos de los genes diferencialmente expresados.
df.fc <- read.csv('../rnaseq/deseq/data/resultado.csv')

padj.cutoff <- 0.05
lfc.cutoff <- log2(1.5)

genes.up <- df.fc$X[df.fc$log2FoldChange >= lfc.cutoff & df.fc$padj <= padj.cutoff]
genes.down <- df.fc$X[df.fc$log2FoldChange <= -1 * lfc.cutoff & df.fc$padj <= padj.cutoff]

## datos para pathway
geneList <- df.fc$log2FoldChange[df.fc$X %in% c(genes.up, genes.down)]
names(geneList) <- c(genes.up, genes.down)
geneList <- geneList[order(geneList, decreasing = TRUE)]


genes.dge <- c(genes.up, genes.down)
allgenes <- df.fc$X
Análisis GO
El paquete clusterProfiler implementa la función enrichGO().
Biological Process
Important
En este ejemplo vamos a utilizar el nombre del gen (SYMBOL) para las consultas ya que es el dato que tenemos en el dataset. Pero esto no es recomendable ya que el nombre del gen puede ser ambiguo. Es mejor utilizar ENSEMBL o ENTREZID. En este caso podemos añadir el parametro readable = TRUE a la función enrichGO() para que traduzca los genes ID a nombre de genes.
keytypes(org.Hs.eg.db) [1] "ACCNUM" "ALIAS" "ENSEMBL" "ENSEMBLPROT" "ENSEMBLTRANS"
[6] "ENTREZID" "ENZYME" "EVIDENCE" "EVIDENCEALL" "GENENAME"
[11] "GENETYPE" "GO" "GOALL" "IPI" "MAP"
[16] "OMIM" "ONTOLOGY" "ONTOLOGYALL" "PATH" "PFAM"
[21] "PMID" "PROSITE" "REFSEQ" "SYMBOL" "UCSCKG"
[26] "UNIPROT" go.BP <- enrichGO(gene = genes.dge,
universe = allgenes,
OrgDb = org.Hs.eg.db,
keyType = "SYMBOL",
ont = "BP",
pAdjustMethod = "BH"
)
head(go.BP)| ID | Description | GeneRatio | BgRatio | RichFactor | FoldEnrichment | zScore | pvalue | p.adjust | qvalue | geneID | Count | |
|---|---|---|---|---|---|---|---|---|---|---|---|---|
| GO:0030198 | GO:0030198 | extracellular matrix organization | 30/509 | 230/11940 | 0.1304348 | 3.059708 | 6.655671 | 0.00e+00 | 0.0000645 | 0.0000618 | ADAMTS1/ADAMTS10/ADAMTS2/ADAMTS7/ADAMTSL3/COL13A1/COL23A1/COL2A1/COL3A1/COL5A1/CREB3L1/DPP4/EGFLAM/HAPLN2/ITGA8/LAMA1/LAMB1/LAMC1/LUM/MATN3/MMP2/NID2/NPNT/NTN4/OLFML2A/PAPLN/RECK/SULF1/THSD4/ADAMTS16 | 30 |
| GO:0043062 | GO:0043062 | extracellular structure organization | 30/509 | 231/11940 | 0.1298701 | 3.046462 | 6.627513 | 0.00e+00 | 0.0000645 | 0.0000618 | ADAMTS1/ADAMTS10/ADAMTS2/ADAMTS7/ADAMTSL3/COL13A1/COL23A1/COL2A1/COL3A1/COL5A1/CREB3L1/DPP4/EGFLAM/HAPLN2/ITGA8/LAMA1/LAMB1/LAMC1/LUM/MATN3/MMP2/NID2/NPNT/NTN4/OLFML2A/PAPLN/RECK/SULF1/THSD4/ADAMTS16 | 30 |
| GO:0045229 | GO:0045229 | external encapsulating structure organization | 30/509 | 231/11940 | 0.1298701 | 3.046462 | 6.627513 | 0.00e+00 | 0.0000645 | 0.0000618 | ADAMTS1/ADAMTS10/ADAMTS2/ADAMTS7/ADAMTSL3/COL13A1/COL23A1/COL2A1/COL3A1/COL5A1/CREB3L1/DPP4/EGFLAM/HAPLN2/ITGA8/LAMA1/LAMB1/LAMC1/LUM/MATN3/MMP2/NID2/NPNT/NTN4/OLFML2A/PAPLN/RECK/SULF1/THSD4/ADAMTS16 | 30 |
| GO:0099084 | GO:0099084 | postsynaptic specialization organization | 10/509 | 40/11940 | 0.2500000 | 5.864440 | 6.502646 | 4.80e-06 | 0.0048754 | 0.0046640 | CNTNAP1/LRRC4B/LRRTM2/NPTX1/NTNG2/SHANK1/SHANK2/LRRC4/NRXN1/ZDHHC12 | 10 |
| GO:0097106 | GO:0097106 | postsynaptic density organization | 9/509 | 34/11940 | 0.2647059 | 6.209407 | 6.418678 | 8.70e-06 | 0.0070421 | 0.0067368 | CNTNAP1/LRRC4B/LRRTM2/NPTX1/SHANK1/SHANK2/LRRC4/NRXN1/ZDHHC12 | 9 |
| GO:1901342 | GO:1901342 | regulation of vasculature development | 23/509 | 203/11940 | 0.1133005 | 2.657776 | 5.026851 | 1.81e-05 | 0.0121113 | 0.0115863 | ADAMTS1/ADM2/ALOX5/CREB3L1/CXCL12/DLL1/EFNA1/FUT1/HSPB1/HSPG2/ITGA5/MDK/PGF/PLK2/PLXND1/RAPGEF3/RECK/RRAS/SULF1/TSPAN18/XBP1/ZC3H12A/ANGPT2 | 23 |
barplot(go.BP, showCategory = 15)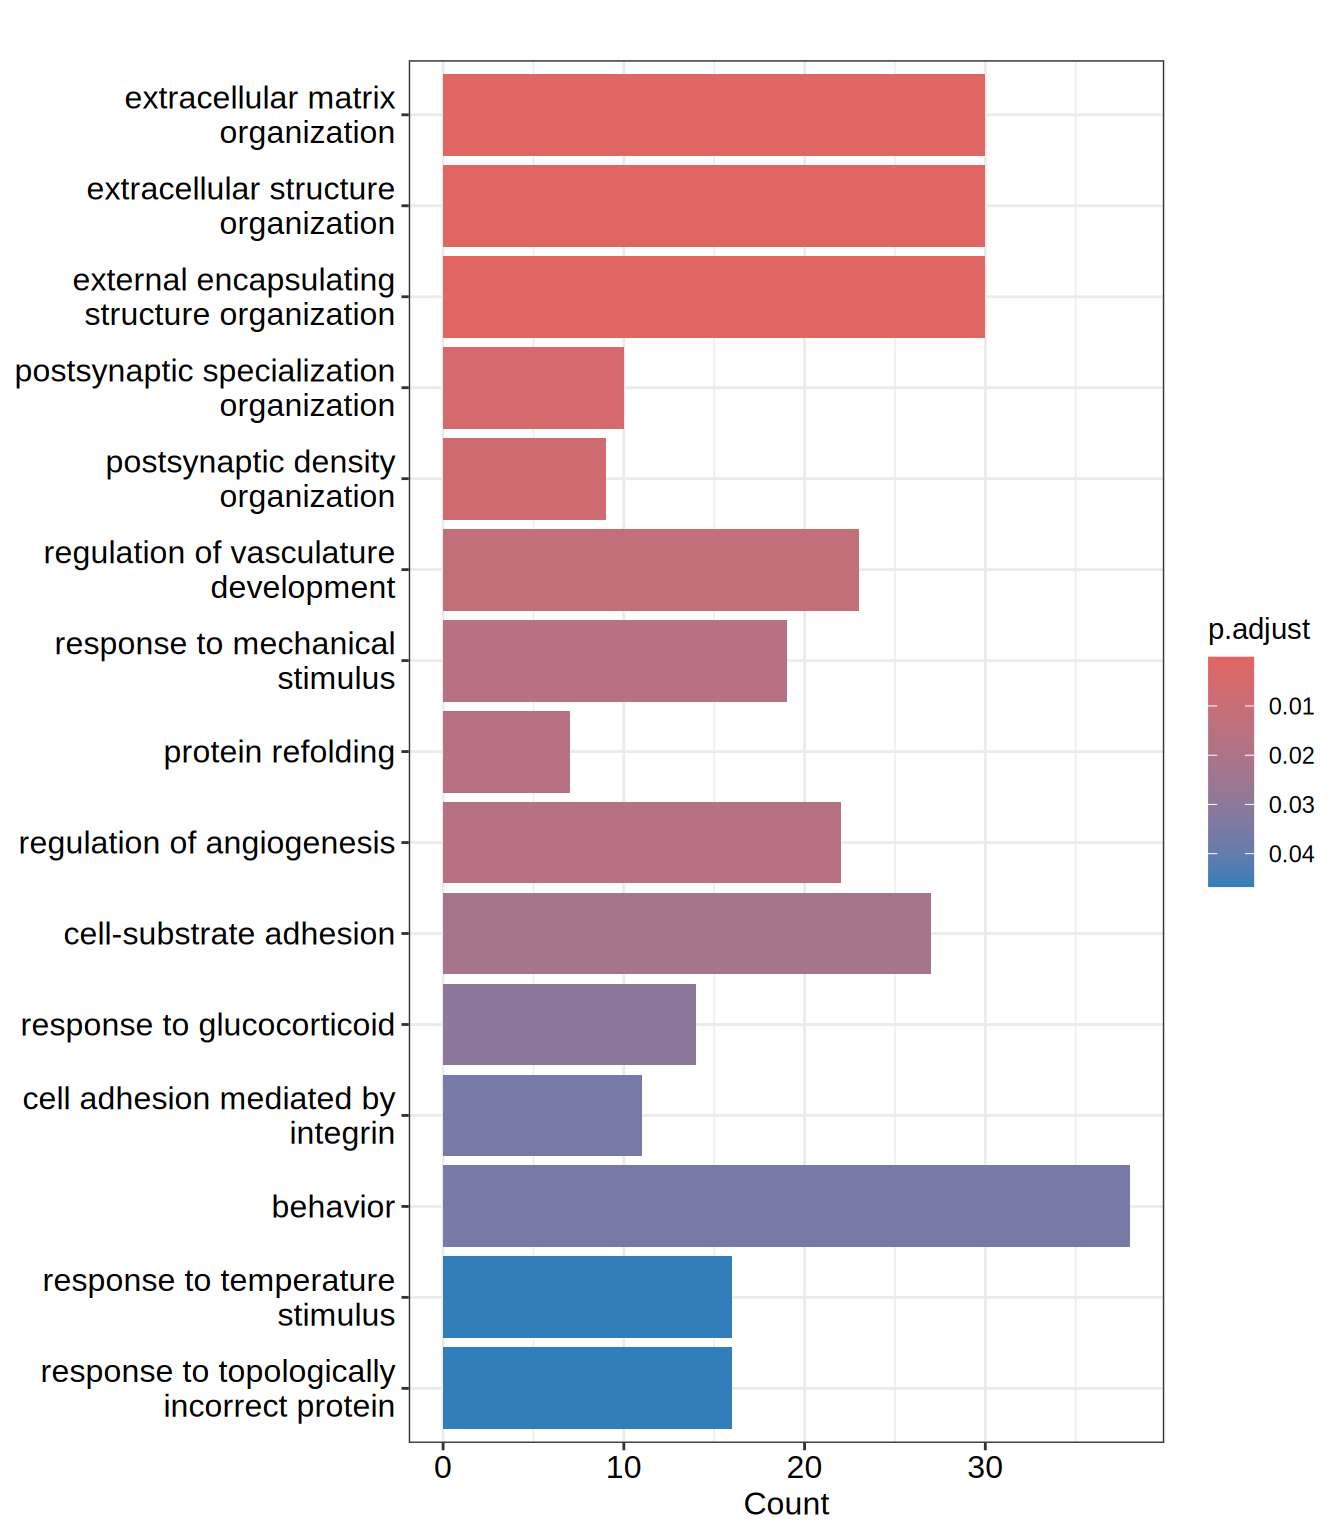
dotplot(go.BP, showCategory = 15)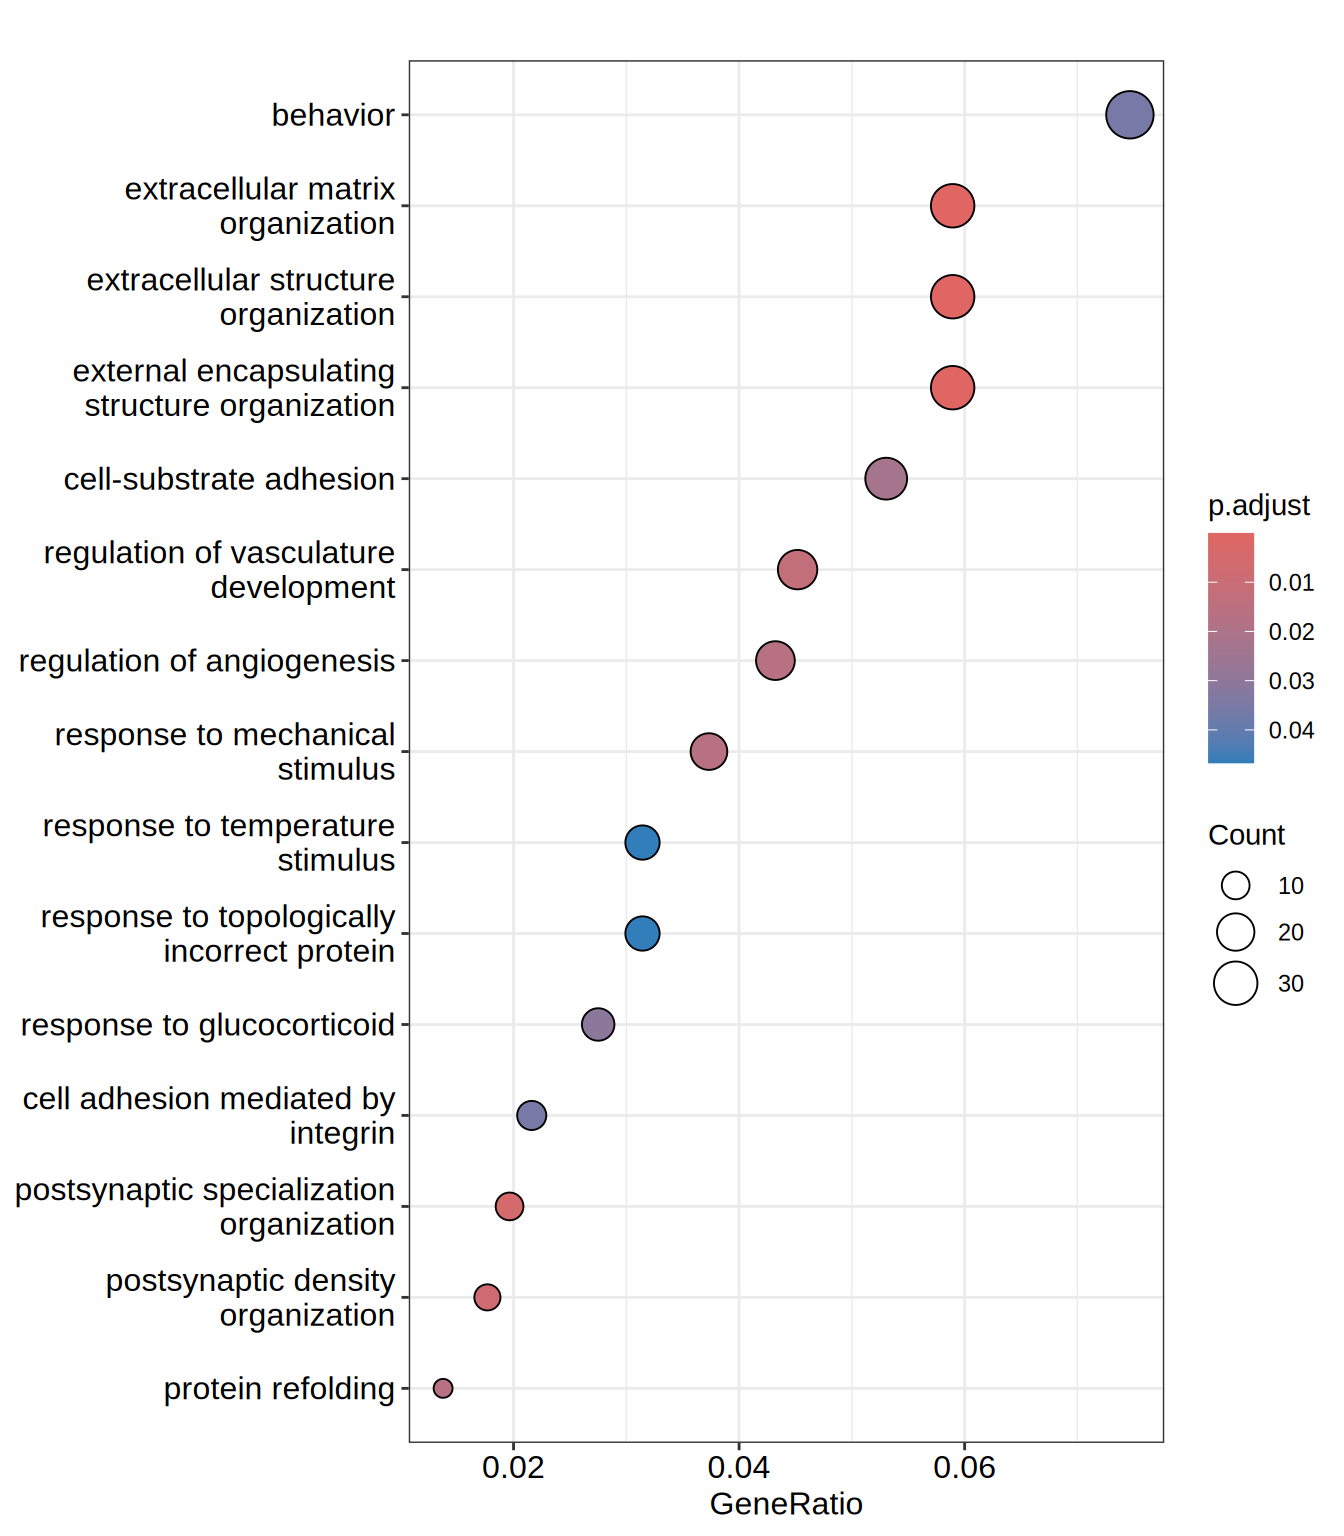
Molecular Function
go.MF <- enrichGO(gene          = genes.dge,
                  universe      = allgenes,
                  OrgDb         = org.Hs.eg.db,
                  keyType       = "SYMBOL",
                  ont           = "MF",
                  pAdjustMethod = "BH"
                )

head(go.MF)| ID | Description | GeneRatio | BgRatio | RichFactor | FoldEnrichment | zScore | pvalue | p.adjust | qvalue | geneID | Count | |
|---|---|---|---|---|---|---|---|---|---|---|---|---|
| GO:0005201 | GO:0005201 | extracellular matrix structural constituent | 24/506 | 105/12095 | 0.2285714 | 5.463580 | 9.598550 | 0.0000000 | 0.0000000 | 0.0000000 | ACAN/AGRN/COL13A1/COL21A1/COL23A1/COL2A1/COL3A1/COL5A1/COL6A2/EFEMP1/FBN3/HSPG2/IGFBP7/LAMA1/LAMB1/LAMC1/LTBP4/LUM/MATN3/NID2/NPNT/SRPX/THBS3/THSD4 | 24 |
| GO:0005539 | GO:0005539 | glycosaminoglycan binding | 19/506 | 132/12095 | 0.1439394 | 3.440607 | 5.891176 | 0.0000023 | 0.0007422 | 0.0007050 | ACAN/ADAMTS1/AGRN/APLP2/CD44/COL13A1/COL23A1/COL5A1/EGFLAM/HAPLN2/LTBP4/MDK/NOD2/PGF/SLIT3/SULF1/THBS3/HDGF/TMEM184A | 19 |
| GO:0005509 | GO:0005509 | calcium ion binding | 36/506 | 445/12095 | 0.0808989 | 1.933739 | 4.193530 | 0.0001146 | 0.0242589 | 0.0230425 | AGRN/CAPN12/CDH23/CDH3/CDHR1/DCHS1/DLL1/DYSF/EFEMP1/EGFLAM/FAM20C/FBN3/GALNT3/HSPG2/ITGA5/ITPR3/LTBP4/MATN3/MEGF6/NID2/NOTCH3/NPNT/PCDH18/PCDHB10/RASGRP2/SCUBE1/SCUBE3/SLIT3/SNED1/SPOCK1/SULF1/SYT17/SYT2/SYT6/THBS3/NRXN1 | 36 |
| GO:0030546 | GO:0030546 | signaling receptor activator activity | 22/506 | 224/12095 | 0.0982143 | 2.347632 | 4.253916 | 0.0001774 | 0.0281657 | 0.0267533 | ADM2/CHGB/CRLF1/CXCL12/DLL1/DPP4/EFEMP1/EGFR/GDF15/GDNF/HSPA1A/IL11/IL32/INHBE/MDK/METRNL/NRTN/PGF/SCG2/SEMA5B/TSLP/HDGF | 22 |
| GO:0048018 | GO:0048018 | receptor ligand activity | 21/506 | 219/12095 | 0.0958904 | 2.292084 | 4.031949 | 0.0003432 | 0.0435811 | 0.0413957 | ADM2/CHGB/CRLF1/CXCL12/DLL1/DPP4/EFEMP1/GDF15/GDNF/HSPA1A/IL11/IL32/INHBE/MDK/METRNL/NRTN/PGF/SCG2/SEMA5B/TSLP/HDGF | 21 |
| GO:0022843 | GO:0022843 | voltage-gated monoatomic cation channel activity | 11/506 | 79/12095 | 0.1392405 | 3.328288 | 4.338180 | 0.0004228 | 0.0440472 | 0.0418384 | CACNA1G/CACNG6/HVCN1/KCNAB2/KCNG1/KCNH3/KCNJ4/KCNQ1/KCNT2/SNAP25/TRPV1 | 11 |
barplot(go.MF, showCategory = 15)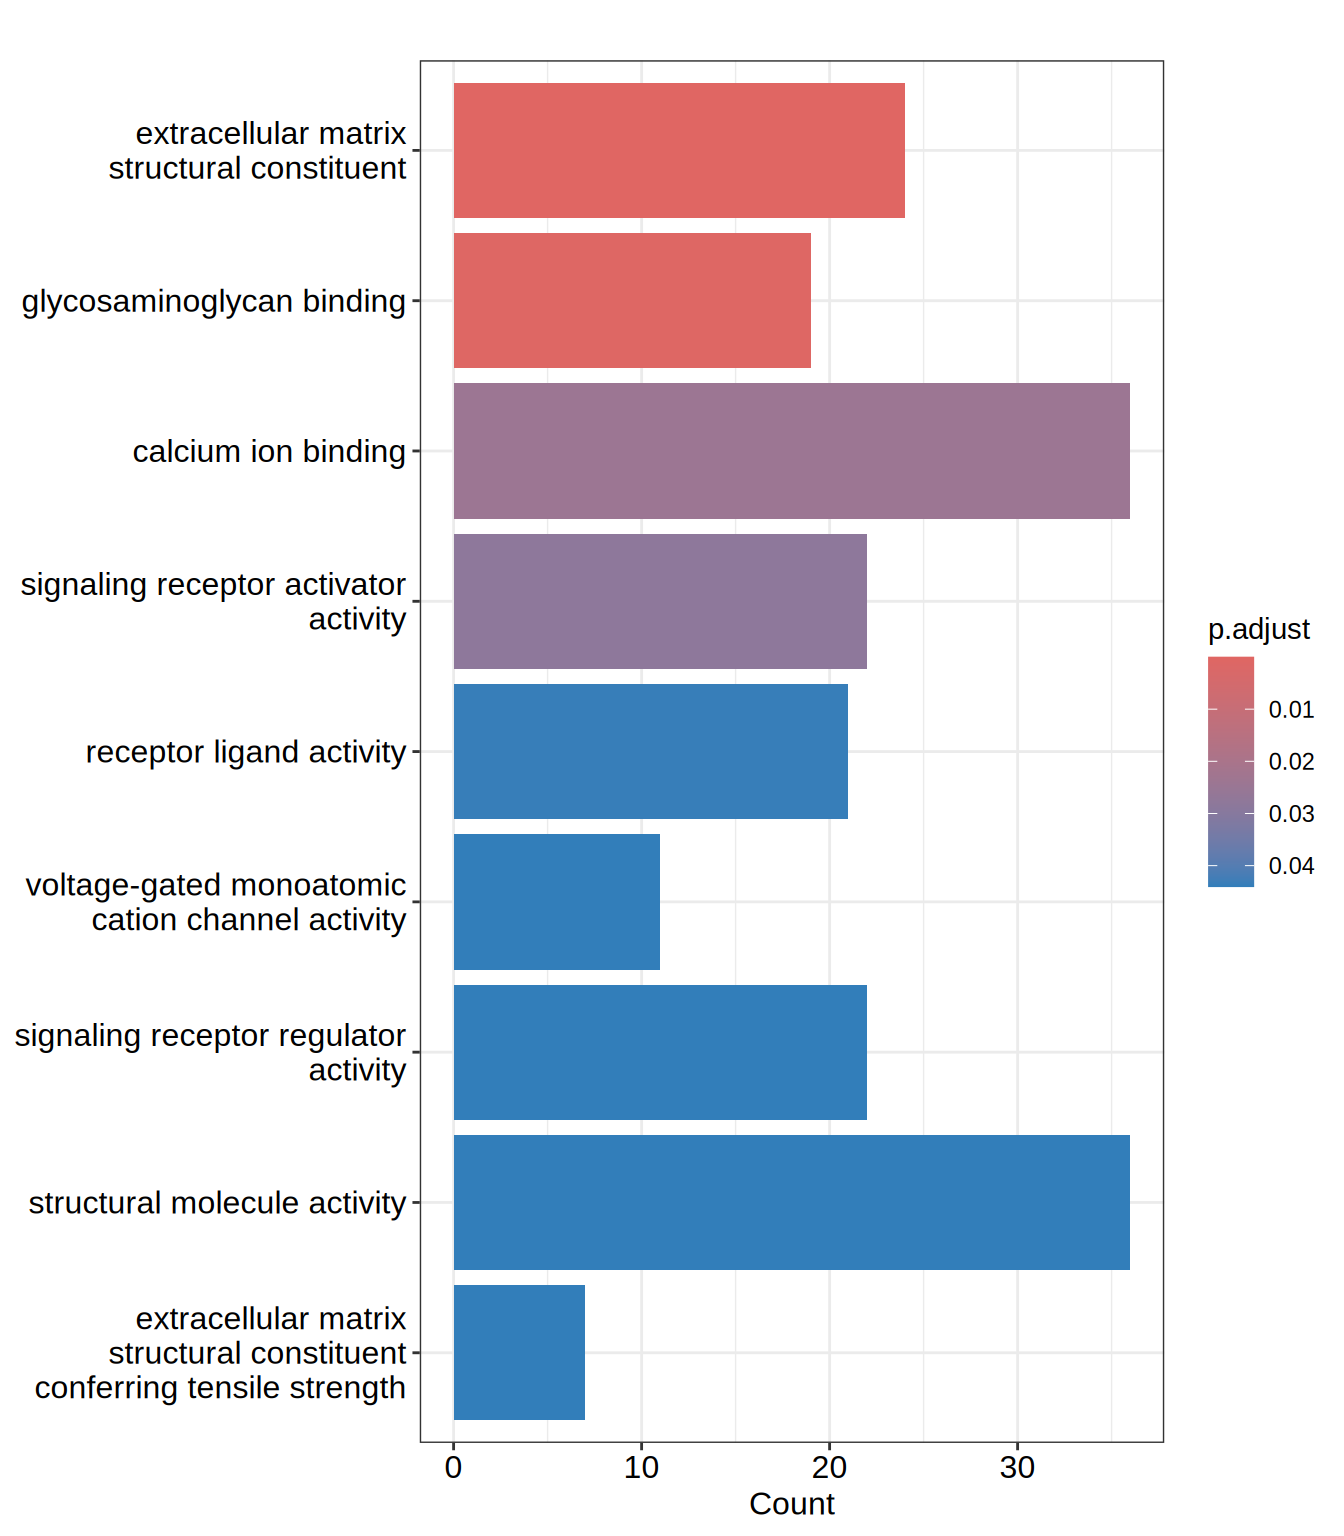
dotplot(go.MF, showCategory = 15)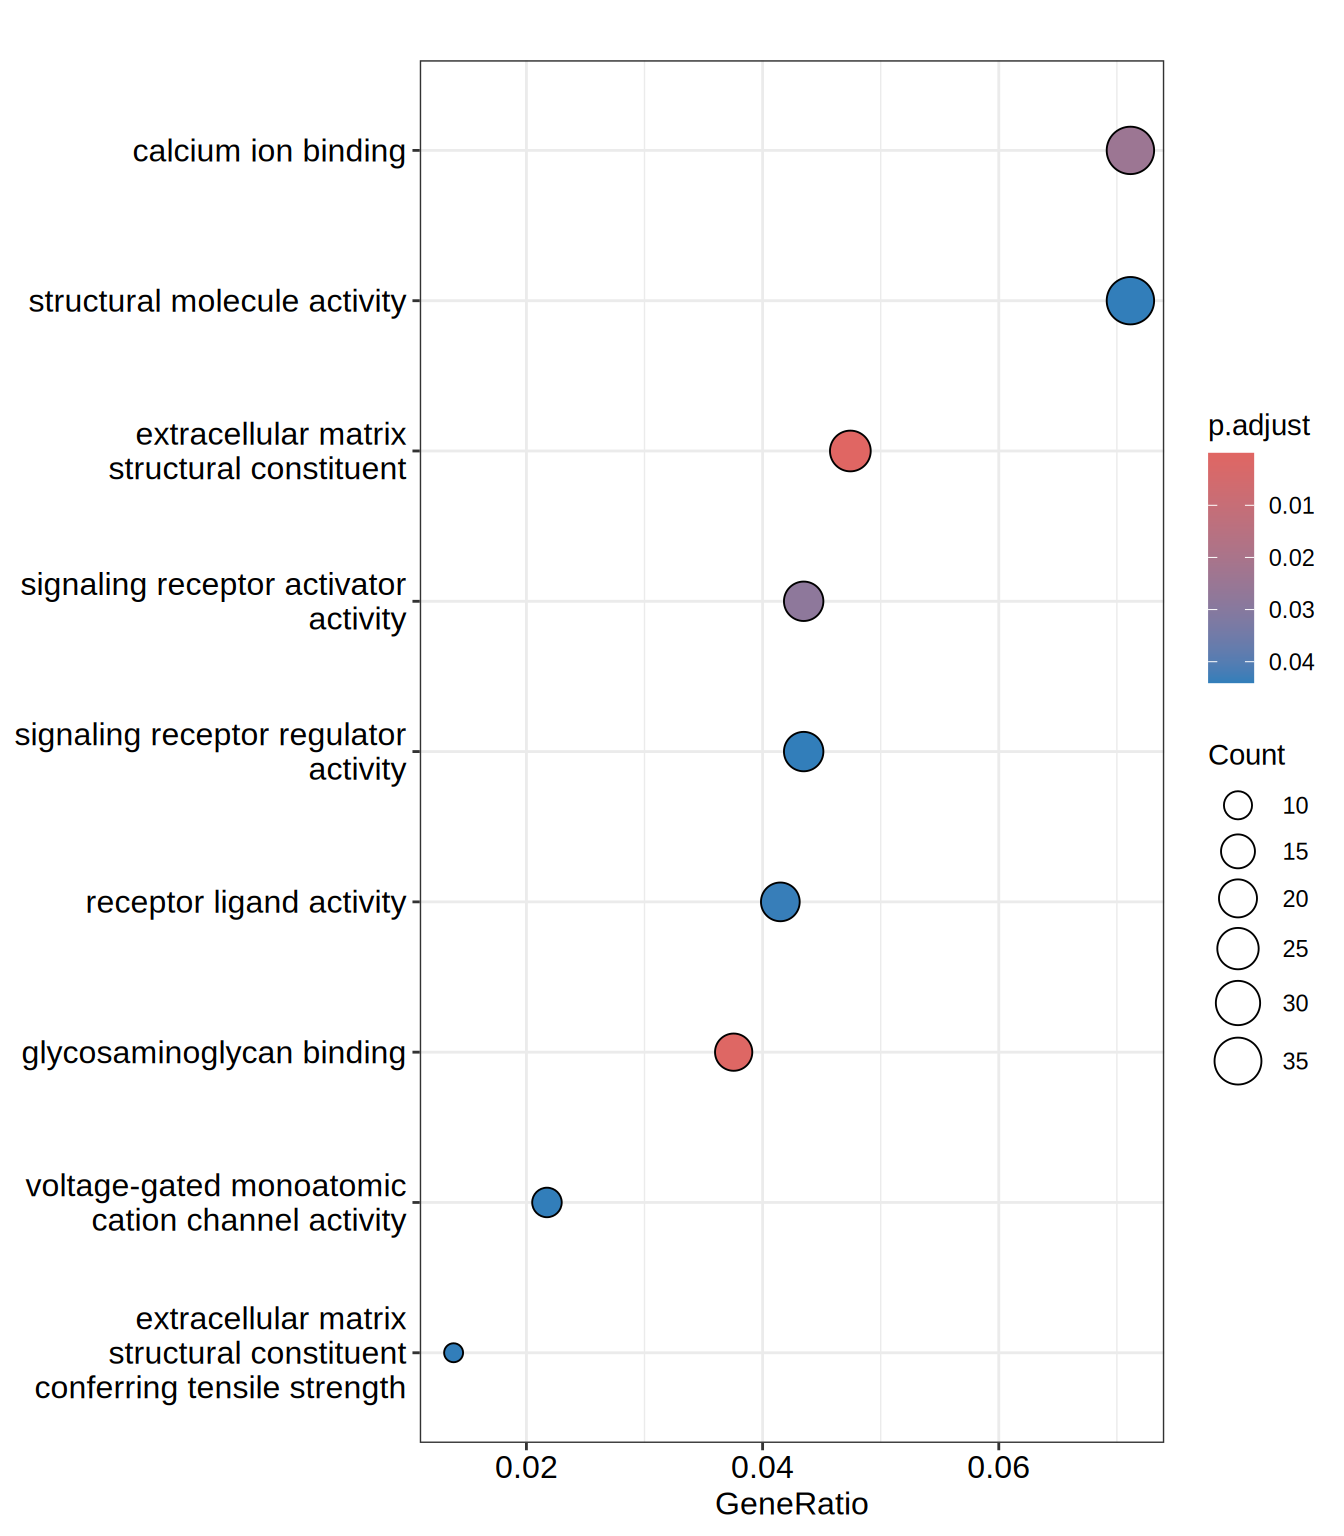
Cellular Component
go.CC <- enrichGO(gene          = genes.dge,
                  universe      = allgenes,
                  OrgDb         = org.Hs.eg.db,
                  keyType       = "SYMBOL",
                  ont           = "CC",
                  pAdjustMethod = "BH"
                )

head(go.CC)| ID | Description | GeneRatio | BgRatio | RichFactor | FoldEnrichment | zScore | pvalue | p.adjust | qvalue | geneID | Count | |
|---|---|---|---|---|---|---|---|---|---|---|---|---|
| GO:0062023 | GO:0062023 | collagen-containing extracellular matrix | 42/528 | 259/12370 | 0.1621622 | 3.799140 | 9.612940 | 0.0000000 | 0.0000000 | 0.0000000 | ACAN/ACHE/ADAMTS1/ADAMTS10/ADAMTS2/AGRN/BCAM/COL13A1/COL21A1/COL23A1/COL2A1/COL3A1/COL5A1/COL6A2/CXCL12/EFEMP1/EGFLAM/GDF15/HAPLN2/HSPG2/HTRA1/IGFBP7/INHBE/ITIH5/LAMA1/LAMB1/LAMC1/LTBP4/LUM/MATN3/MDK/MMP2/NID2/NPNT/NTN4/SRPX/SULF1/THBS3/THSD4/ANGPT2/HDGF/HNRNPM | 42 |
| GO:0030312 | GO:0030312 | external encapsulating structure | 48/528 | 335/12370 | 0.1432836 | 3.356852 | 9.234288 | 0.0000000 | 0.0000000 | 0.0000000 | ACAN/ACHE/ADAMTS1/ADAMTS10/ADAMTS2/ADAMTS7/ADAMTSL3/AGRN/BCAM/COL13A1/COL21A1/COL23A1/COL2A1/COL3A1/COL5A1/COL6A2/CXCL12/EFEMP1/EGFLAM/FBN3/GDF15/HAPLN2/HSPG2/HTRA1/IGFBP7/INHBE/ITIH5/LAMA1/LAMB1/LAMC1/LTBP4/LUM/MATN3/MDK/MMP2/NID2/NPNT/NTN4/OLFML2A/SNED1/SRPX/SULF1/THBS3/THSD4/ADAMTS16/ANGPT2/HDGF/HNRNPM | 48 |
| GO:0031012 | GO:0031012 | extracellular matrix | 48/528 | 335/12370 | 0.1432836 | 3.356852 | 9.234288 | 0.0000000 | 0.0000000 | 0.0000000 | ACAN/ACHE/ADAMTS1/ADAMTS10/ADAMTS2/ADAMTS7/ADAMTSL3/AGRN/BCAM/COL13A1/COL21A1/COL23A1/COL2A1/COL3A1/COL5A1/COL6A2/CXCL12/EFEMP1/EGFLAM/FBN3/GDF15/HAPLN2/HSPG2/HTRA1/IGFBP7/INHBE/ITIH5/LAMA1/LAMB1/LAMC1/LTBP4/LUM/MATN3/MDK/MMP2/NID2/NPNT/NTN4/OLFML2A/SNED1/SRPX/SULF1/THBS3/THSD4/ADAMTS16/ANGPT2/HDGF/HNRNPM | 48 |
| GO:0005604 | GO:0005604 | basement membrane | 14/528 | 76/12370 | 0.1842105 | 4.315690 | 6.122176 | 0.0000034 | 0.0003562 | 0.0003404 | ACHE/ADAMTS1/AGRN/COL23A1/COL2A1/COL5A1/EGFLAM/HSPG2/LAMA1/LAMB1/LAMC1/NID2/NPNT/NTN4 | 14 |
| GO:0098636 | GO:0098636 | protein complex involved in cell adhesion | 9/528 | 40/12370 | 0.2250000 | 5.271307 | 5.713220 | 0.0000367 | 0.0031137 | 0.0029761 | ITGA11/ITGA4/ITGA5/ITGA8/JAM2/LAMA1/LAMB1/LAMC1/PLAU | 9 |
| GO:0009897 | GO:0009897 | external side of plasma membrane | 21/528 | 200/12370 | 0.1050000 | 2.459943 | 4.395187 | 0.0001286 | 0.0090870 | 0.0086854 | ABCA1/ACE/ATP1B2/BCAM/CD24/CRLF1/CXCL12/FCGRT/IL1R1/ITGA11/ITGA4/ITGA5/ITGA8/MCAM/PLAU/SCUBE1/TNFRSF13C/TNFRSF9/ULBP2/CCR6/TRPV1 | 21 |
barplot(go.CC, showCategory = 15)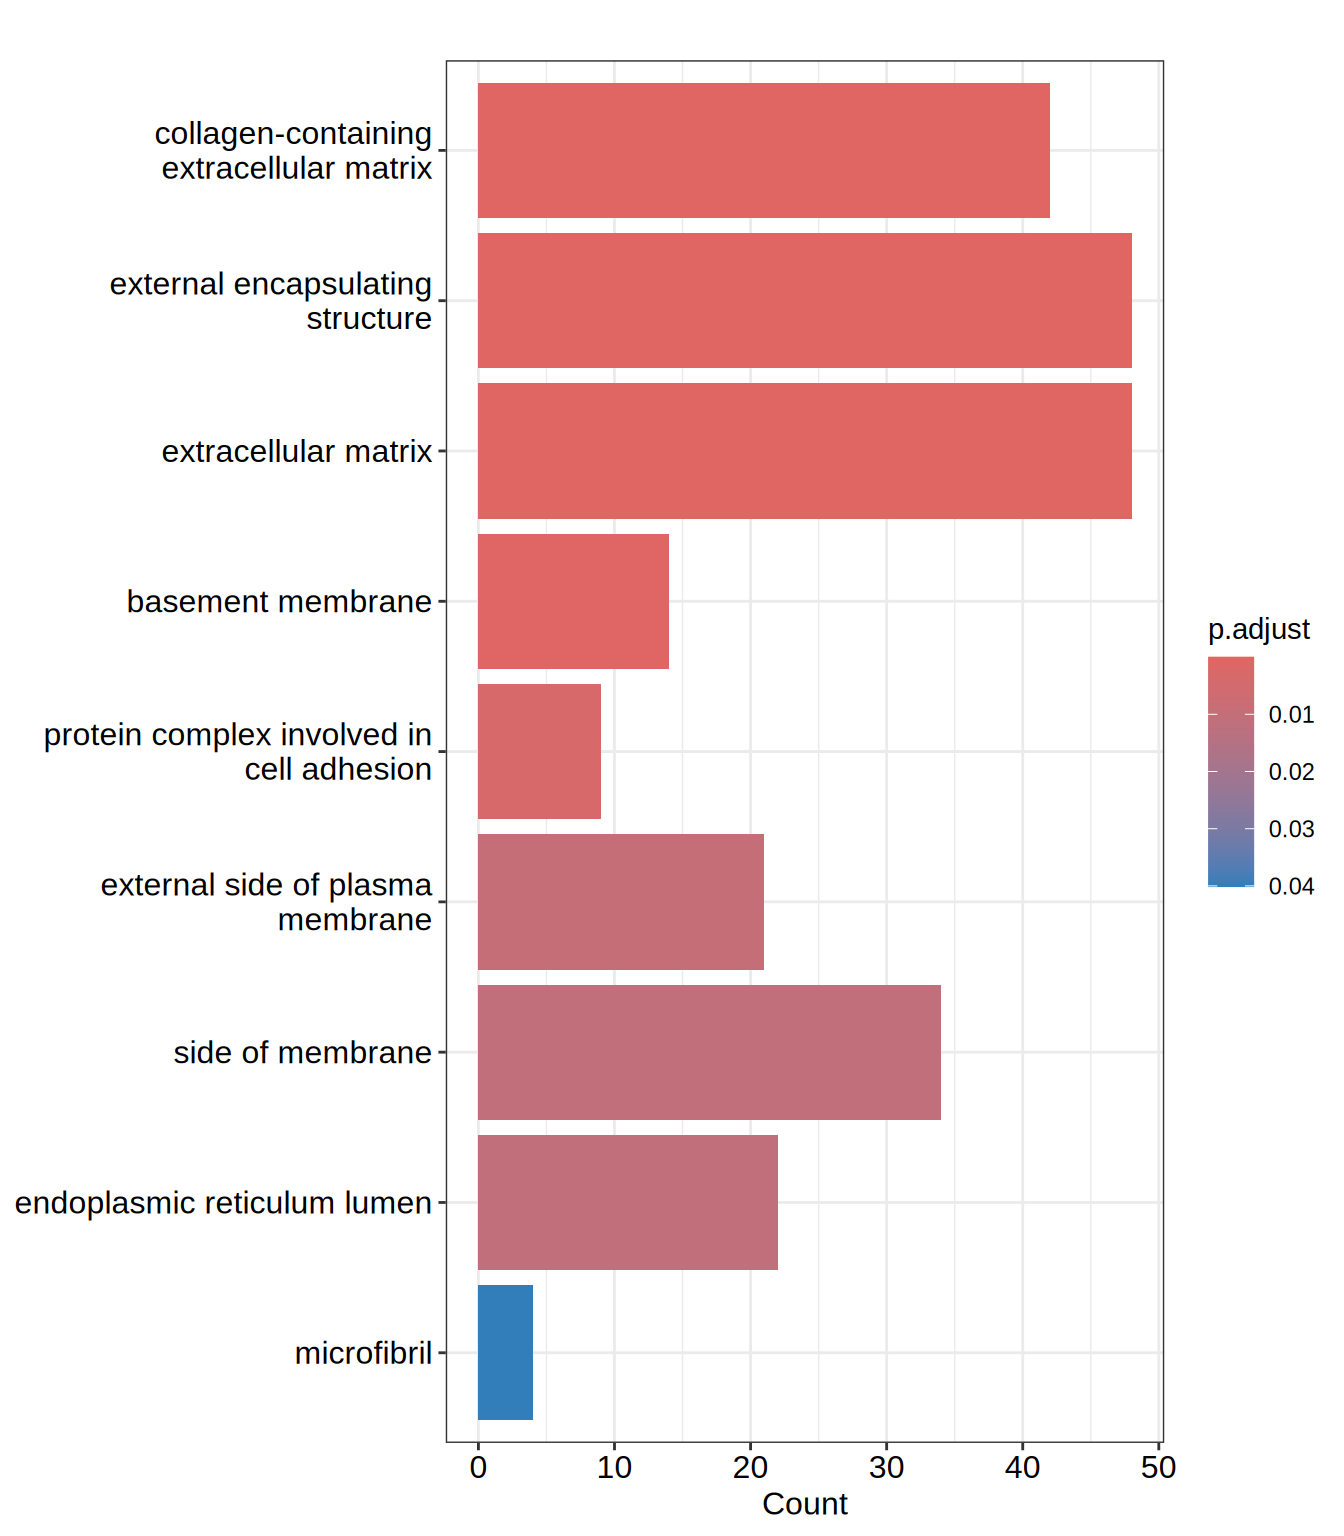
dotplot(go.CC, showCategory = 15)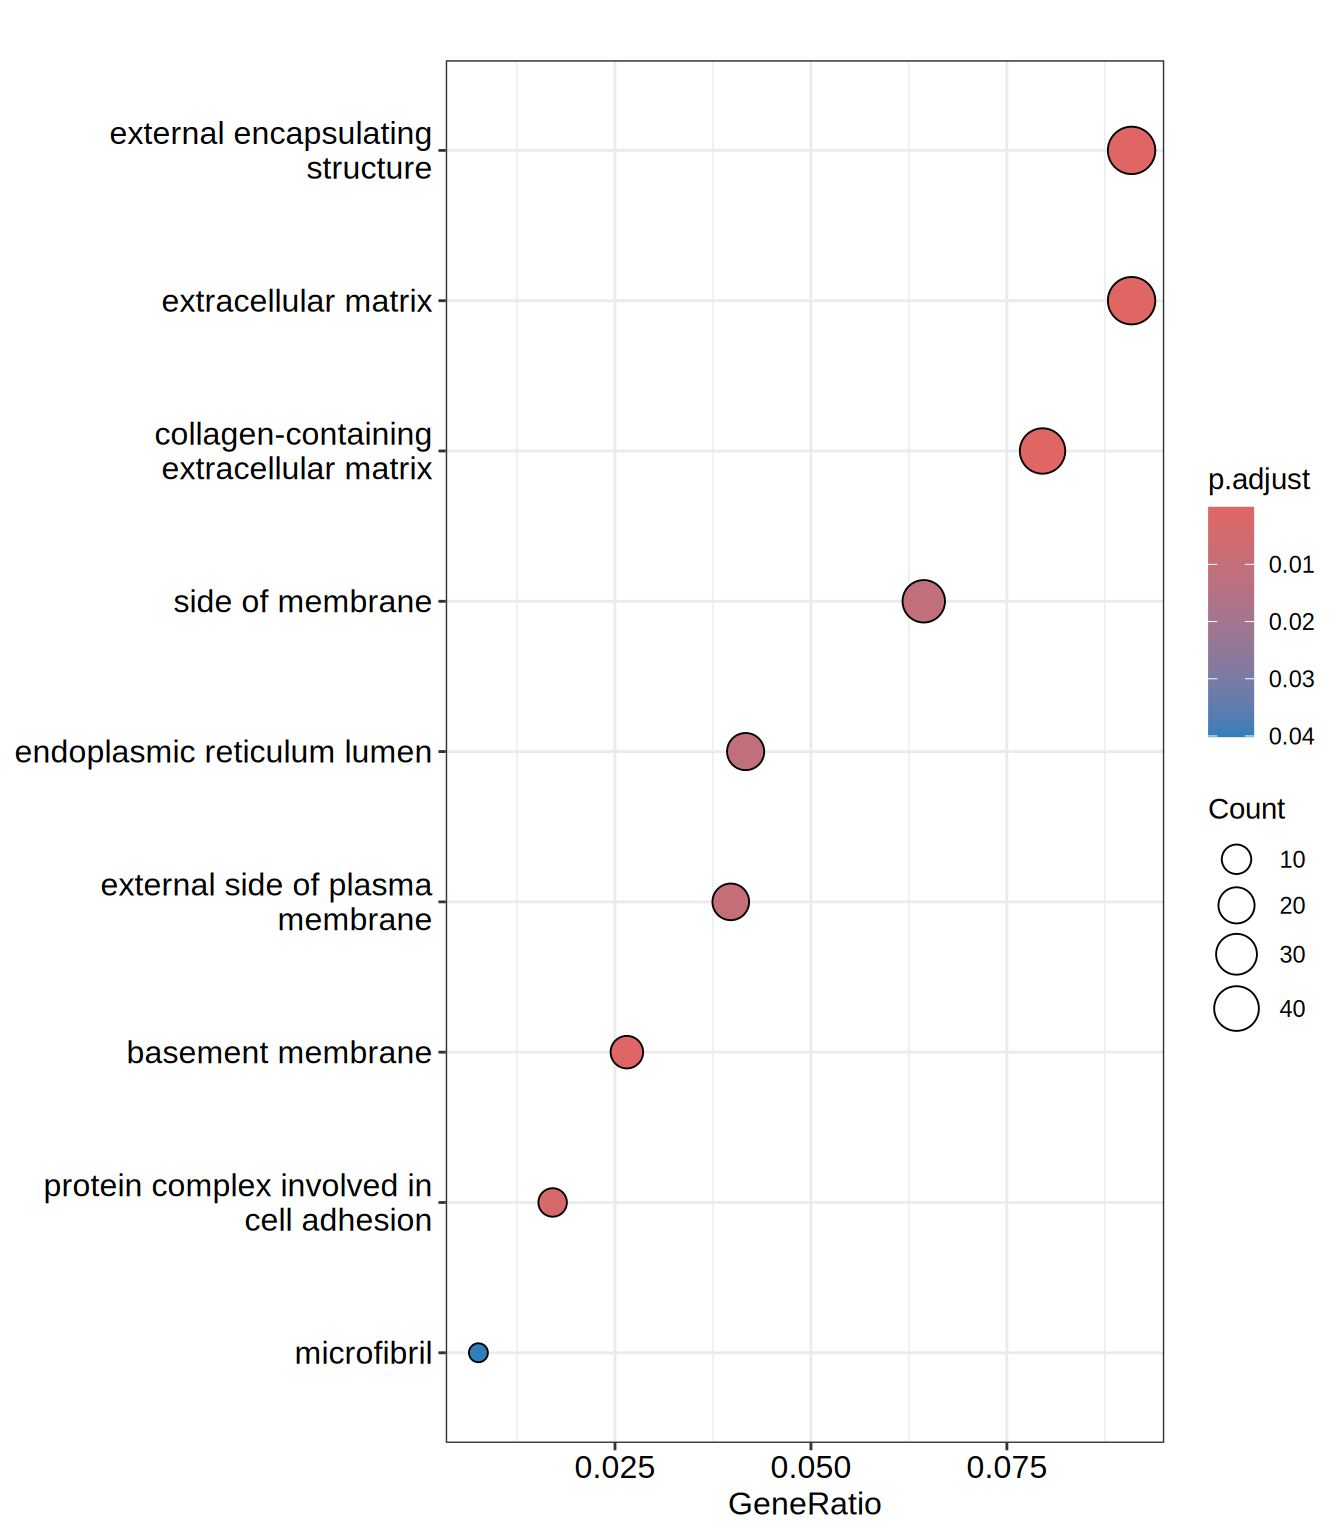
KEGG pathway over-representation analysis
El paquete clusterProfiler soporta todos los organismos que tienen anotación de la base da datos KEGG. Para realizar el análisis de sobrerepresentación usaremos la función enrichKEGG(). Esta función no acepta los genes con nombre (SYMBOL), el valor debe de ser ENTREZID. Podemos traducir los simbolos usando la función bitr()(Biological Id TranslatoR).
allgenes.entrezid <- bitr(allgenes,
                          fromType = 'SYMBOL',
                          toType = 'ENTREZID',
                          OrgDb = 'org.Hs.eg.db'
                          )
genes.dge.entrezid <- bitr(genes.dge,
                          fromType = 'SYMBOL',
                          toType = 'ENTREZID',
                          OrgDb = 'org.Hs.eg.db'
                          )
head(genes.dge.entrezid)| SYMBOL | ENTREZID |
|---|---|
| A4GALT | 53947 |
| ABCA1 | 19 |
| ABHD14B | 84836 |
| ABL2 | 27 |
| ACADVL | 37 |
| ACAN | 176 |
kegg <- enrichKEGG(gene         = genes.dge.entrezid$ENTREZID,
                   organism     = 'hsa',
                   universe     = allgenes.entrezid$ENTREZID)

head(kegg)| category | subcategory | ID | Description | GeneRatio | BgRatio | RichFactor | FoldEnrichment | zScore | pvalue | p.adjust | qvalue | geneID | Count | |
|---|---|---|---|---|---|---|---|---|---|---|---|---|---|---|
| hsa04512 | Environmental Information Processing | Signaling molecules and interaction | hsa04512 | ECM-receptor interaction | 14/271 | 70/5880 | 0.2000000 | 4.339483 | 6.177801 | 0.0000026 | 0.0007670 | 0.0007380 | 375790/960/1280/1292/3339/22801/3676/3678/8516/284217/3912/3915/255743/7059 | 14 |
| hsa04820 | NA | NA | hsa04820 | Cytoskeleton in muscle cells | 20/271 | 176/5880 | 0.1136364 | 2.465616 | 4.338907 | 0.0001513 | 0.0220196 | 0.0211873 | 375790/482/1281/1289/1292/2027/84467/2318/3339/22801/3676/3678/8516/284217/25802/22795/84033/7059/22989/4703 | 20 |
| hsa04151 | Environmental Information Processing | Signal transduction | hsa04151 | PI3K-Akt signaling pathway | 26/271 | 276/5880 | 0.0942029 | 2.043960 | 3.904656 | 0.0003581 | 0.0298425 | 0.0287145 | 595/1026/1280/1292/90993/64764/54541/1942/1956/2065/2668/22801/3676/3678/8516/3718/284217/3912/3915/9863/4902/5105/5228/7059/285/2790 | 26 |
| hsa04974 | Organismal Systems | Digestive system | hsa04974 | Protein digestion and absorption | 10/271 | 61/5880 | 0.1639344 | 3.556954 | 4.412221 | 0.0004102 | 0.0298425 | 0.0287145 | 482/1305/81578/91522/1280/1281/1289/1292/1803/3784 | 10 |
dotplot(kegg, showCategory = 15)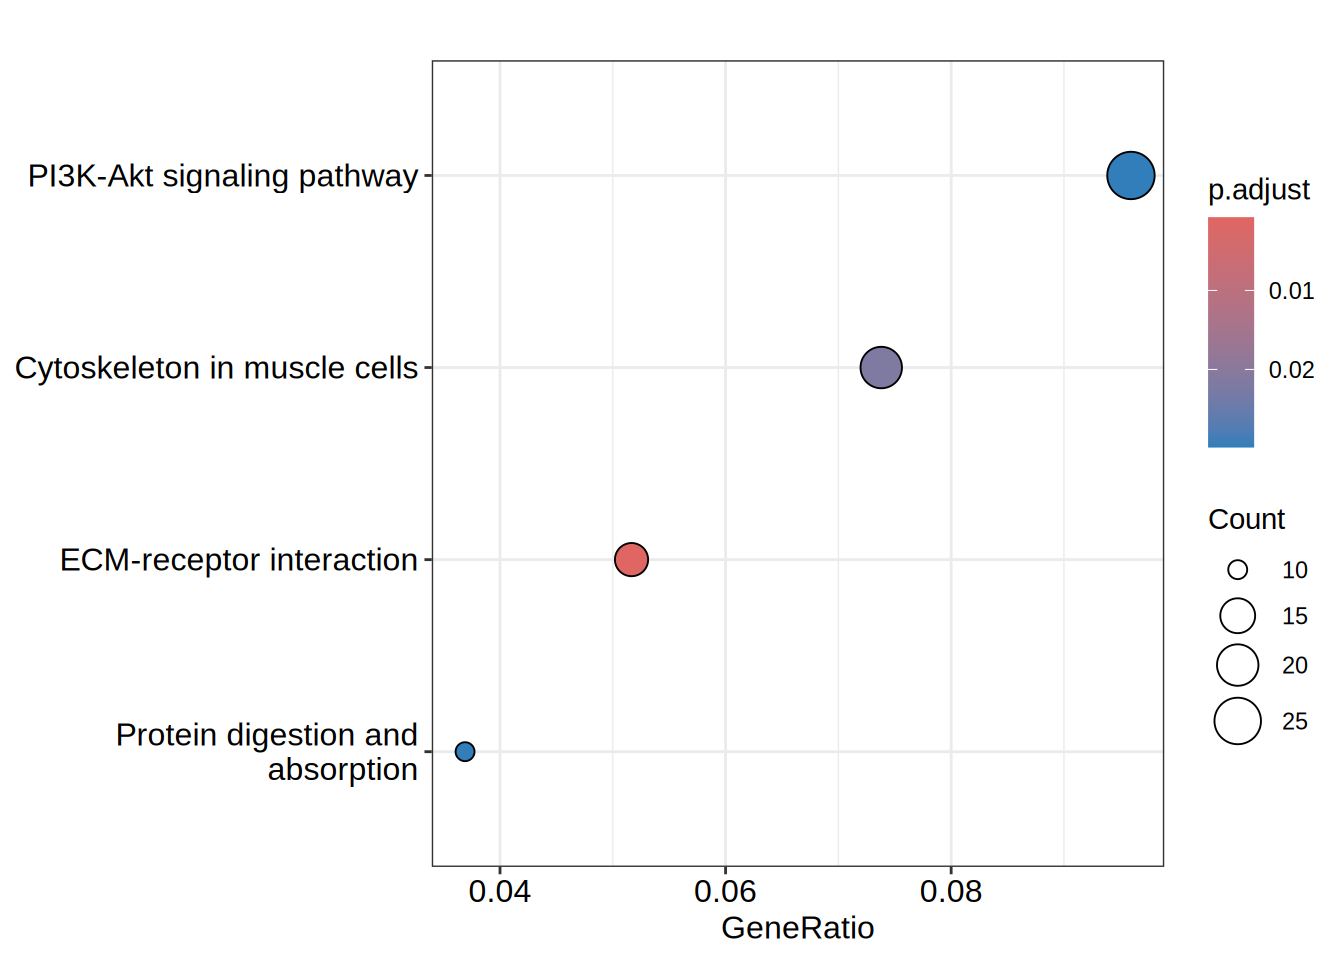
En el paquete clusterProfiler viene incluida la funcion browseKEGG() que ayuda a explorar los vías enriquecidas de KEGG con los genes de interes. La función browseKEGG() abrira la ruta especificada en un navegador destacando los genes de interes.
browseKEGG(kegg, 'hsa04512')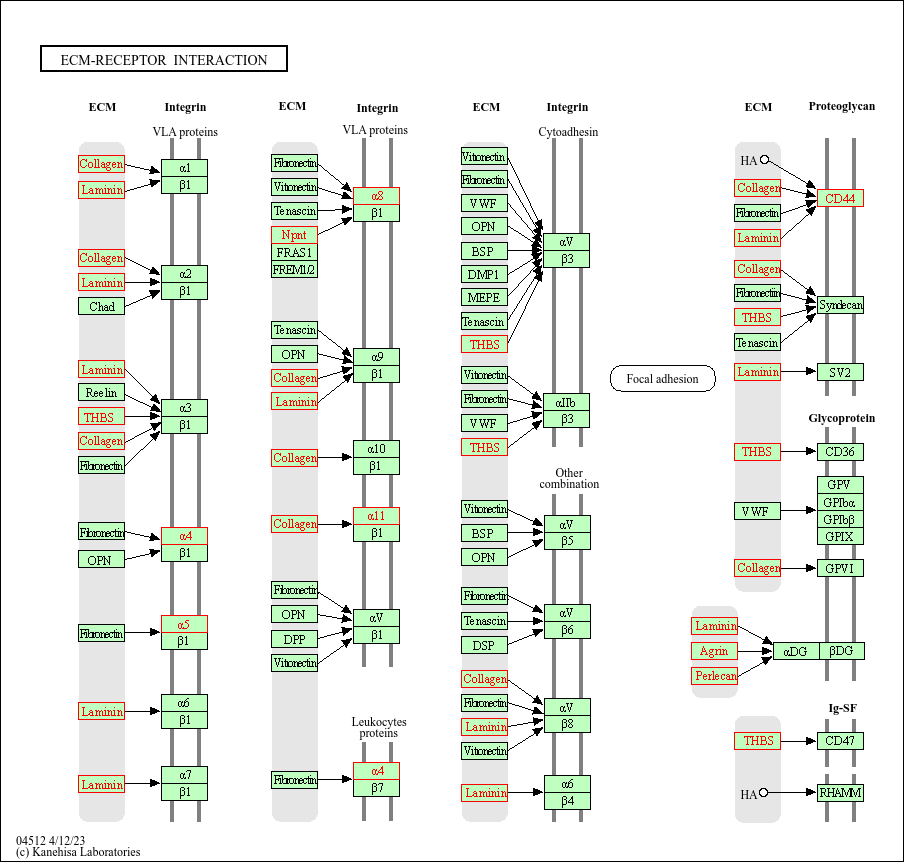
browseKEGG(kegg, 'hsa04151')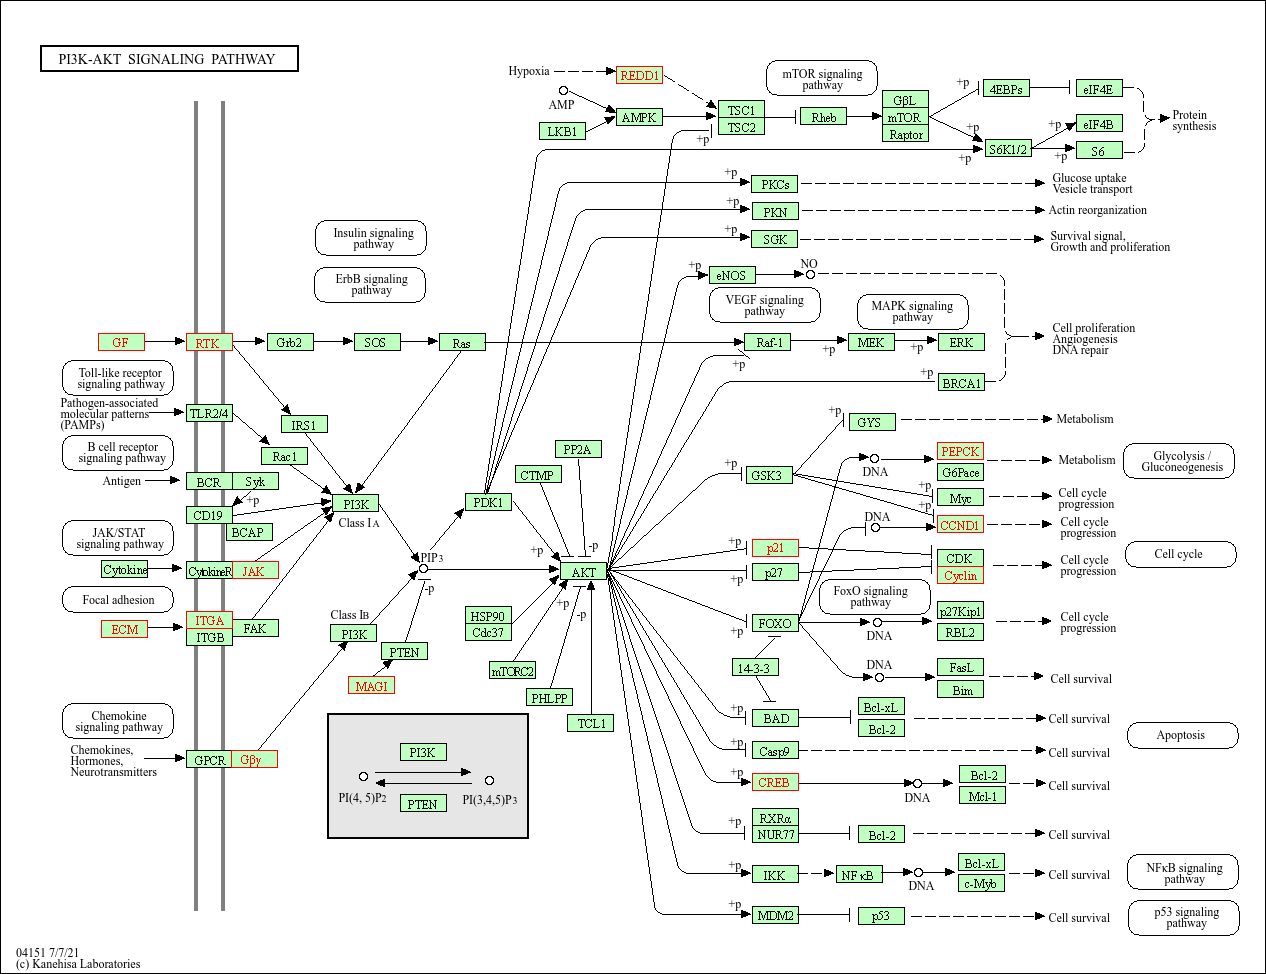
Pathways
genes.dge.entrezid <- bitr(names(geneList),
                          fromType = 'SYMBOL',
                          toType = 'ENTREZID',
                          OrgDb = 'org.Hs.eg.db'
                          )
names(geneList) <- genes.dge.entrezid$ENTREZID
core <- geneInCategory(kegg)[['hsa04512']]
hsa04512 <- pathview(gene.data = geneList,
pathway.id = "hsa04512",
species = "hsa",
limit = list(gene=round(max(abs(geneList[core])), 1), cpd=1))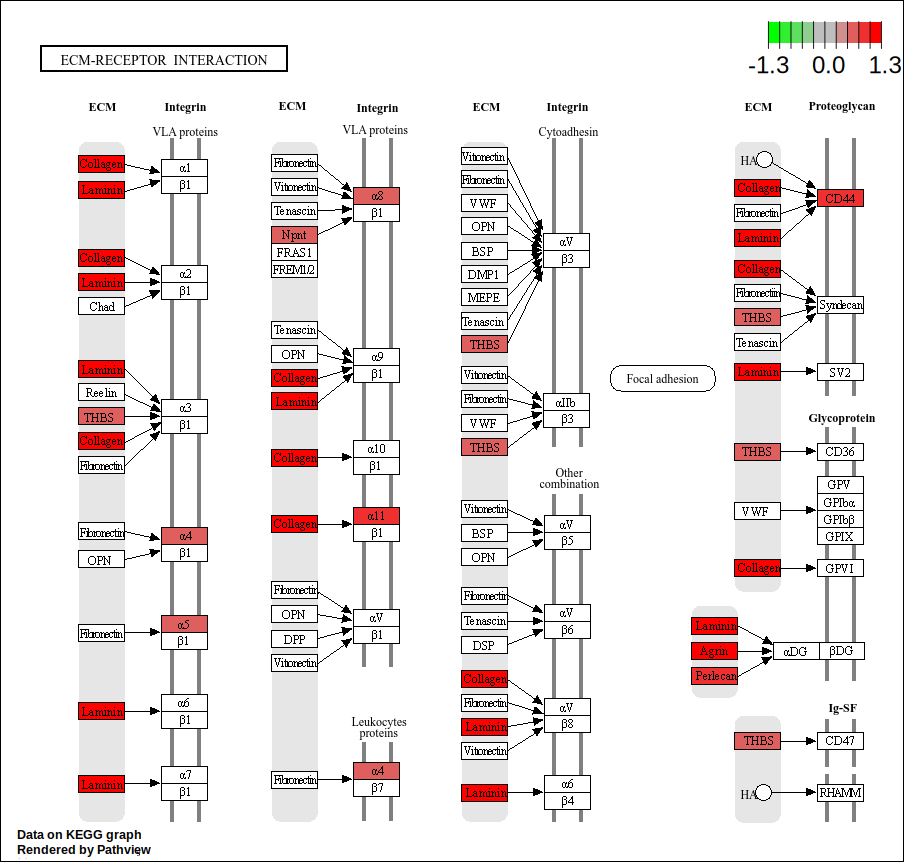
core <- geneInCategory(kegg)[['hsa04151']]

hsa04151<- pathview(gene.data  = geneList,
                     pathway.id = "hsa04151",
                     species    = "hsa",
                     limit      = list(gene=round(max(abs(geneList[core])), 1), cpd=1))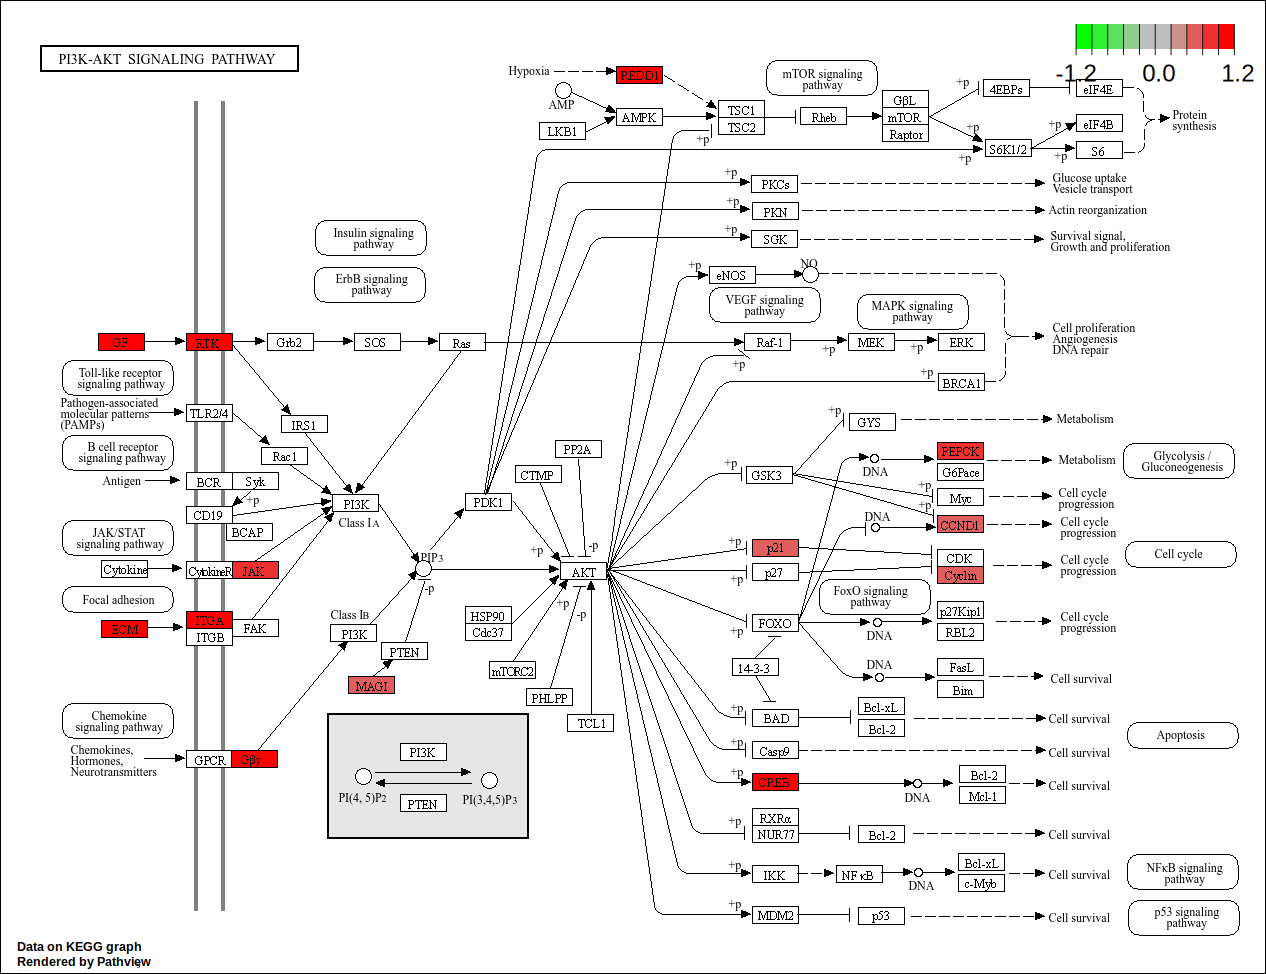
Referencias
citation("clusterProfiler")Please cite S. Xu (2024) for using clusterProfiler. In addition, please
cite G. Yu (2010) when using GOSemSim, G. Yu (2015) when using DOSE and
G. Yu (2015) when using ChIPseeker.
S Xu, E Hu, Y Cai, Z Xie, X Luo, L Zhan, W Tang, Q Wang, B Liu, R
Wang, W Xie, T Wu, L Xie, G Yu. Using clusterProfiler to characterize
multiomics data. Nature Protocols. 2024,
doi:10.1038/s41596-024-01020-z
T Wu, E Hu, S Xu, M Chen, P Guo, Z Dai, T Feng, L Zhou, W Tang, L
Zhan, X Fu, S Liu, X Bo, and G Yu. clusterProfiler 4.0: A universal
enrichment tool for interpreting omics data. The Innovation. 2021,
2(3):100141
Guangchuang Yu, Li-Gen Wang, Yanyan Han and Qing-Yu He.
clusterProfiler: an R package for comparing biological themes among
gene clusters. OMICS: A Journal of Integrative Biology 2012,
16(5):284-287
To see these entries in BibTeX format, use 'print(<citation>,
bibtex=TRUE)', 'toBibtex(.)', or set
'options(citation.bibtex.max=999)'.